Zapping liquid metal droplets with ultrasound offers a new way to make wiring for stretchy, bendy electronics.
The technique, described in the Nov. 11 Science, adds a new approach to the toolbox for researchers developing circuitry for medical sensors that attach to the skin, wearable electronics and other applications where rigid circuit electronics are less than ideal (SN: 6/1/18).
The researchers began by drawing on sheets of stretchy plastic with lines of microscopic droplets made of an alloy of gallium and indium. The metal alloy is liquid at temperatures above about 16° Celsius.
Though the liquid metal is electrically conductive, the droplets quickly oxidize. That process covers each of them with a thin insulating layer. The layers carry static charges that push the drops apart, making them useless for connecting the LEDs, microchips and other components in electronic circuitry.
By hitting the microspheres with high-frequency sound waves, the researchers caused the microscopic balls to shed even smaller, nanoscopic balls of liquid metal. The tiny spheres bridge the gaps between the larger ones, and that close contact allows electrons to tunnel through the oxide layers so that the droplets can carry electricity.
When the plastic that the drops are printed on is stretched or bent, the larger balls of metal can deform, while the smaller ones act like rigid particles that shift around to maintain contact.
The researchers demonstrated their conductors by connecting electronics into a stretchy pattern of LEDs displaying the initials of the Dynamic Materials Design Laboratory, where the work was done. The team also built a sensor with the conductors that can monitor blood through a person’s skin (SN: 2/17/18).
Flexible electronics applications aren’t new, says materials scientist Jiheong Kang of the Korea Advanced Institute of Science and Technology in Daejeon, South Korea. But there are advantages of the new approach over other designs, he says, such as those that rely on channels filled with liquid metal that can leak if the circuitry is damaged. Liquid metal in the conductors that Kang and colleagues developed stays trapped in the tiny spheres that are embedded in the plastic and remains in place even if the material is torn.
Wires made of liquid metal have often been the go-to conductors for stretchy electronics, says Carmel Majidi, a researcher in mechanical engineering at Carnegie Mellon University in Pittsburgh who was not involved with the new study. Using ultrasound introduces a “novel approach to achieving that conductivity.” Other groups have managed that feat by heating circuits, exposing them to lasers, squishing them or vibrating the circuits to get droplets to connect to each other, he says.
Majidi isn’t convinced that the ultrasound approach is a game changer for flexible circuits. But he says that it’s high time the subject is appearing in a leading journal like Science. “I’m personally really excited to see the field overall, and this particular type of material architecture, is now gaining this visibility.”
DENVER — A hidden landscape riddled with landslides is coming into focus in Yellowstone National Park, thanks to a laser-equipped airplane.
Scientists of yore crisscrossed Yellowstone on foot and studied aerial photographs to better understand America’s first national park. But today researchers have a massive new digital dataset at their fingertips that’s shedding new light on this nearly 1-million-hectare natural wonderland.
These observations of Yellowstone have allowed a pair of researchers to pinpoint over 1,000 landslides within and near the park, hundreds of which had not been mapped before, the duo reported October 9 at the Geological Society of America Connects 2022 meeting. Most of these landslides likely occurred thousands of years ago, but some are still moving. Mapping Yellowstone’s landslides is important because they can cripple infrastructure like roadways and bridges. The millions of visitors that explore the park each year access Yellowstone through just a handful of entrance roads, one of which recently closed for months following intense flooding.
In 2020, a small aircraft flew a few hundred meters above the otherworldly landscape of Yellowstone. But it wasn’t ferrying tourists eager for up close views of the park’s famous wolves or hydrothermal vents (SN: 7/21/20, SN: 1/11/21). Instead, the plane carried a downward-pointing laser that fired pulses of infrared light at the ground. By measuring the timing of pulses that hit the ground and reflected back toward the aircraft, researchers reconstructed the precise topography of the landscape.
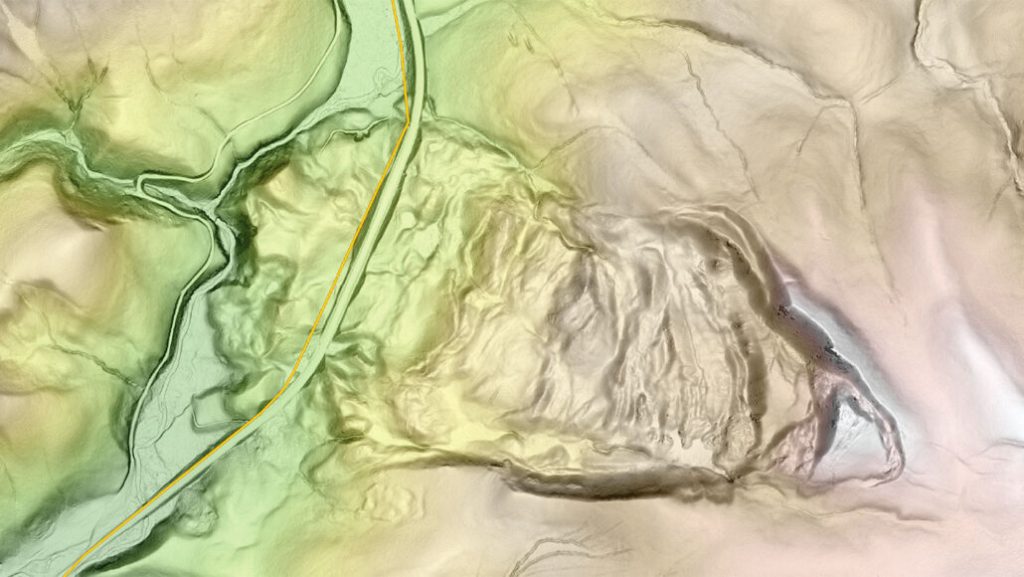
Such “light detection and ranging,” or lidar, data reveal details that often remain hidden to the eye. “We’re able to see the surface of the ground as if there’s no vegetation,” says Kyra Bornong, a geoscientist at Idaho State University in Pocatello. Similar lidar observations have been used to pinpoint pre-Columbian settlements deep within the Amazon jungle (SN: 5/25/22).
The Yellowstone lidar data were collected as part of the 3D Elevation Program, an ongoing project spearheaded by the United States Geological Survey to map the entirety of the United States using lidar. Bornong and geomorphologist Ben Crosby analyzed the Yellowstone data — which resolve details as small as about one meter — to home in on landslides. The team searched for places where the landscape changed from looking relatively smooth to looking jumbled, evidence that soil and rocks had once been on the move. “It’s a pattern-recognition game,” says Crosby, also of Idaho State University. “You’re looking for this contrast between the lumpy stuff and the smooth stuff.”
The researchers spotted more than 1,000 landslides across Yellowstone, most of which were clustered near the periphery of the park. That makes sense given the geography of Yellowstone’s interior, says Lyman Persico, a geomorphologist at Whitman College in Walla Walla, Wash., who was not involved in the research. The park sits atop a supervolcano, whose previous eruptions blanketed much of the park in lava (SN: 1/2/18). “You’re sitting in the middle of the Yellowstone caldera, where everything is flat,” says Persico.
But steep terrain also abounds in the national park, and there’s infrastructure in many of those landslide-prone areas. In several places, the team found that roads had been built over landslide debris. One example is Highway 191, which skirts the western edge of Yellowstone.
An aerial image of U.S. Highway 191 near Yellowstone shows barely perceptible signs of a long-ago landslide. But laser mapping reveals the structure and extent of the landslide in much greater detail (use the slider to compare images). It’s one of more than 1,000 landslides uncovered by new maps. It’s worth keeping an eye on this highway since it funnels significant amounts of traffic through regions apt to experience landslides, Bornong says. “It’s one of the busiest roads in Montana.”
There’s plenty more to learn from this novel look at Yellowstone, Crosby says. Lidar data can shed light on geologic processes like volcanic and tectonic activity, both of which Yellowstone has in spades. “It’s a transformative tool,” he says.
In July 2017, after weeks of anticipation, a massive iceberg about the size of Delaware split from the Antarctic Peninsula (SN: 7/12/17). Satellite images show that the orphaned iceberg, known as A68, ultimately disintegrated in the Southern Ocean. Now, researchers say they have pieced together the powerful forces that led to that final breakup.
Polar scientist Alex Huth of Princeton University and colleagues combined observations of the iceberg’s drift with simulations of ocean currents and wind stress. Iceberg A68a, the largest remaining chunk of the original berg, was caught in a tug-of-war of ocean currents, and the strain of those opposing forces probably pulled the iceberg apart, the team reports October 19 in Science Advances. After A68’s separation from the Larsen C ice shelf, researchers had questions — such as what creatures live on the seafloor in the ice’s dark shadow (SN: 2/8/19). As for the iceberg itself, it took a while to get moving, lingering in the neighborhood for about a year (SN: 7/23/18). By December 2020, satellite images show, the berg had clearly seen some action and was just two-thirds of its original size. The new simulations suggest how A68a probably met its fate. On December 20, 2020, the long, slender “finger” at one end of the iceberg drifted into a strong, fast-moving current. The rest of the ice remained outside the current. The tension rifted the berg, and the finger sheared off and broke apart within a few days.
Shear stress is a previously unknown mechanism for large iceberg breakup, and isn’t represented in climate simulations, the team says. In the Southern Ocean, the melting of massive bergs can be a large source of cold freshwater to the ocean surface. That, in turn, can have a big impact on ocean circulation and the global climate.
U.S. millennials are rejecting suburbia and moving back to the city. That was a prevailing idea in 2019, when I started as the social sciences reporter at Science News. But when I began digging into a possible story on the phenomenon, I encountered an incoherent mess. Some research showed that suburbs were growing, others that suburbs were shrinking and yet others showed growth in both suburbs and cities.
Unable to make sense of that maze of findings, I shelved the story idea. Then, several months later, I stumbled across a Harvard University white paper explaining that disagreement in the field stems from competing definitions of what distinguishes a city from a suburb. Some researchers define the suburbs as areas falling outside census-designated cities. Others look only for markers of suburbanism, such as a wealth of single-family houses and car-based commutes, the researchers wrote. I have encountered this type of fuzziness around definitions of all sorts of terms and concepts in the years I’ve covered the social sciences. Sometimes researchers simply assume that their definition of a key concept is the definition. Or they nod briefly at other definitions, and then go forth with whichever one they choose, without much explanation why. Other times, researchers in one subfield choose one definition, and researchers in another subfield choose a different one — each without ever knowing of the other’s existence. It’s enough to drive any reporter to tear their hair out.
“If you look … you will find this morass of definitions and measurements” in the social sciences, says quantitative psychologist Jessica Flake of McGill University in Montreal. My experience was a common one, she assured me.
Definitional morasses exist in other scientific fields too. Biologists frequently disagree about how best to define the word “species” (SN: 11/1/17). Virologists squabble over what counts as “alive” when it comes to viruses (SN: 11/1/21). And not all astronomers are happy with the decision to define the word “planet” in a way that left Pluto out in the cold as a mere dwarf planet (SN: 8/24/21).
But the social sciences have some special challenges, Flake says. The field is a youngster compared with a discipline like astronomy, so has had less time to sort out its definitions. And social science concepts are often inherently subjective. Describing abstract ideas like motivation or feelings can be squishier than describing, say, a meteorite.
It’s tempting to assume, as I did until I began researching this column, that a single, imperfect definition for individual concepts is preferable to this definitional cacophony. And some researchers encourage this approach. “While no suburban definition will be perfect, standardization would increase understanding of how suburban studies relate to each other,” the Harvard researchers wrote in that suburbia paper.
But a recent study taking aim at how we define the middle class showed me how alternative definitions can lead to a shift in perspective.
While most researchers use income as a proxy for class, these researchers used people’s buying patterns. That revealed that a fraction of people who appear middle class by income struggle to pay for basic necessities, such as housing, child care and groceries, the team reported in July in Social Indicators Research. That is, they live as if they are working class.
What’s more, that vulnerable group skews Black and Hispanic, a disparity that arises, in part, because these families of color often lack the generational wealth of white families, says Melissa Haller, a geographer at Binghamton University in New York. So when calamity strikes, families without that financial cushion can struggle to recover. Yet a government or nonprofit organization looking to direct aid toward the neediest families, and relying solely on income-based metrics, would overlook this vulnerable group.
“Depending on what definition you start with, you will see different facts,” says Anna Alexandrova, a philosopher of science at the University of Cambridge. A standardized definition of middle class, for example, could obscure some of those key facts.
In the social sciences, what’s needed instead of conceptual unity, Alexandrova says, is conceptual clarity.
Though social scientists disagree about how to go about solving this problem of clarity, Flake says that failure to tackle the issue jeopardizes the field as much as other crises rocking the discipline (SN: 8/27/18). That’s because how a topic is defined determines the scales, surveys and other instruments used to study that concept. And that in turn shapes how researchers crunch numbers and arrive at conclusions.
Defining one’s key terms and then selecting the right tool is somewhat straightforward when relying on large, external datasets. For instance, instead of using national income databases, as is common in the study of the middle class, Haller and her team turned to the federal government’s Consumer Expenditure Surveys to understand people’s daily and emergency purchases.
But often social scientists, particularly psychologists, develop their own scales and surveys to quantify subjective concepts, such as self-esteem, mood or well-being. Definitions of those terms — and the instruments used to study them — can take on a life of their own, Flake says.
She and her team recently showed how this process plays out in the May-June American Psychologist. They combed through the 100 original studies and 100 replications included in a massive reproducibility project in psychology. The researchers zoomed in on 97 multi-item scales — measuring concepts such as gratitude, motivation and self-esteem — used in the original studies, and found that 54 of those scales had no citations to show where the scales originated. That suggests that the original authors defined their idea, and the tool used to measure that idea, on the fly, Flake says. Research teams then attempted to replicate 29 of those studies without digging into the scales’ sources, calling into question the meaning of their results.
For Flake, the way to achieve conceptual clarity is straightforward, if unlikely. Researchers must hit the brakes on generating new ideas, or replicating old ideas, and instead interrogate the morass of old ones.
She points to one promising, if labor-intensive, effort: the Psychological Science Accelerator, a collaboration of over 1,300 researchers in 84 countries. The project aims to identify big ideas in psychology, such as face perception and gender prejudice, and accumulate all the instruments and resulting data used to make sense of those ideas in order to discard, refine or combine existing definitions and tools.
“Instead of running replications, why don’t we use [this] massive team of researchers who represent a lot of perspectives around the world and review concepts first,” Flake says. “We need to stop replicating garbage.”
Wind turbines could offer a double whammy in the fight against climate change.
Besides harnessing wind to generate clean energy, turbines may help to funnel carbon dioxide to systems that pull the greenhouse gas out of the air (SN: 8/10/21). Researchers say their simulations show that wind turbines can drag dirty air from above a city or a smokestack into the turbines’ wakes. That boosts the amount of CO2 that makes it to machines that can remove it from the atmosphere. The researchers plan to describe their simulations and a wind tunnel test of a scaled-down system at a meeting of the American Physical Society’s Division of Fluid Dynamics in Indianapolis on November 21. Addressing climate change will require dramatic reductions in the amount of carbon dioxide that humans put into the air — but that alone won’t be enough (SN: 3/10/22). One part of the solution could be direct air capture systems that remove some CO2 from the atmosphere (SN: 9/9/22).
But the large amounts of CO2 produced by factories, power plants and cities are often concentrated at heights that put it out of reach of machinery on the ground that can remove it. “We’re looking into the fluid dynamics benefits of utilizing the wake of the wind turbine to redirect higher concentrations” down to carbon capture systems, says mechanical engineer Clarice Nelson of Purdue University in West Lafayette, Ind.
As large, power-generating wind turbines rotate, they cause turbulence that pulls air down into the wakes behind them, says mechanical engineer Luciano Castillo, also of Purdue. It’s an effect that can concentrate carbon dioxide enough to make capture feasible, particularly near large cities like Chicago.
“The beauty is that [around Chicago], you have one of the best wind resources in the region, so you can use the wind turbine to take some of the dirty air in the city and capture it,” Castillo says. Wind turbines don’t require the cooling that nuclear and fossil fuel plants need. “So not only are you producing clean energy,” he says, “you are not using water.”
Running the capture systems from energy produced by the wind turbines can also address the financial burden that often goes along with removing CO2 from the air. “Even with tax credits and potentially selling the CO2, there’s a huge gap between the value that you can get from capturing it and the actual cost” that comes with powering capture with energy that comes from other sources, Nelson says. “Our method would be a no-cost added benefit” to wind turbine farms.
There are probably lots of factors that will impact CO2 transport by real-world turbines, including the interactions the turbine wakes have with water, plants and the ground, says Nicholas Hamilton, a mechanical engineer at the National Renewable Energy Laboratory in Golden, Colo., who was not involved with the new studies. “I’m interested to see how this group scaled their experiment for wind tunnel investigation.”
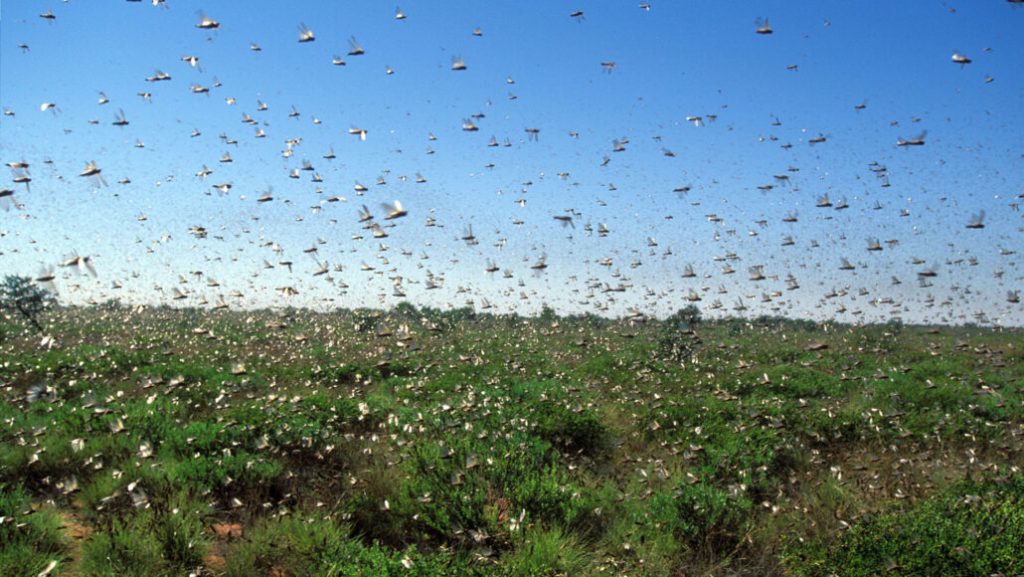
You might feel a spark when you talk to your crush, but living things don’t require romance to make electricity. A study published October 24 in iScience suggests that the electricity naturally produced by swarming insects like honeybees and locusts is an unappreciated contributor to the overall electric charge of the atmosphere.
“Particles in the atmosphere easily charge up,” says Joseph Dwyer, a physicist at the University of New Hampshire in Durham who was not involved with the study. “Insects are little particles moving around the atmosphere.” Despite this, the potential that insect-induced static electricity plays a role in the atmosphere’s electric field, which influences how water droplets form, dust particles move and lightning strikes brew, hasn’t been considered before, he says. Scientists have known about the minuscule electric charge carried by living things, such as insects, for a long time. However, the idea that an electric bug-aloo could alter the charge in the air on a large scale came to researchers through sheer chance.
“We were actually interested in understanding how atmospheric electricity influences biology,” says Ellard Hunting, a biologist at the University of Bristol in England. But when a swarm of honeybees passed over a sensor meant to pick up background atmospheric electricity at the team’s field station, the scientists began to suspect that the influence could flow the other way too.
Hunting and colleagues, including biologists and physicists, measured the change in the strength of electric charge when other honeybee swarms passed over the sensor, revealing an average voltage increase of 100 volts per meter. The denser the insect swarm, the greater the charge produced.
This inspired the team to think about even larger insect swarms, like the biblical hordes of locusts that plagued Egypt in antiquity (and, in 2021, Las Vegas (SN: 3/30/21)). Flying objects, from animals to airplanes, build up static electricity as they move through the air. The team measured the charges of individual desert locusts (Schistocerca gregaria) as they flew in a wind tunnel powered by a computer fan. Taking data on locust density from other studies, the team then used a computer simulation based on the honeybee swarm data to scale up these single locust measurements into electric charge estimates for an entire locust swarm. Clouds of locusts could produce electricity on a per-meter basis on par with that in storm clouds, the scientists report.
Hunting says the results highlight the need to explore the unknown lives of airborne animals, which can sometimes reach much greater heights than honeybees or locusts. Spiders, for example, can soar kilometers above Earth when “ballooning” on silk threads to reach new habitats (SN: 7/5/18). “There’s a lot of biology in the sky,” he says, from insects and birds to microorganisms. “Everything adds up.”
Though some insect swarms can be immense, Dwyer says that electrically charged flying animals are unlikely to ever reach the density required to produce lightning like storm clouds do. But their presence could interfere with our efforts to watch for looming strikes that could hurt people or damage property.
“If you have something messing up our electric field measurements, that could cause a false alarm,” he says, “or it could make you miss something that’s actually important.” While the full effect that insects and other animals have on atmospheric electricity remains to be deduced, Dwyer says these results are “an interesting first look” into the phenomenon.
Hunting says this initial step into an exciting new area of research shows that working with scientists from different fields can spark shocking findings. “Being really interdisciplinary,” he says, “allows for these kinds of serendipitous moments.”
A new video offers the first evidence that these nocturnal lemurs of Madagascar stick their fingers up their noses and lick off the mucus. They don’t use just any finger for the job, either. The primates go spelunking for snot with the ultralong, witchy middle finger they typically use to find and fish grubs out of tree bark.
A reconstruction of the inside of an aye-aye’s head based on CT scans shows that this spindly digit probably pokes all the way through the animal’s nasal passages to reach its throat, researchers report online October 26 in the Journal of Zoology. “This is a brilliant example of how science can serve human curiosity,” says Michael Haslam, a primate archaeologist based in London who was not involved in the new work. “My first take was that it’s a cool — and a bit creepy — video, but [the researchers] have gone beyond that initial reaction of ‘What on Earth?’ to actually explore what’s happening inside the animal.”
The new footage stars Kali, a female aye-aye (Daubentonia madagascariensis) at the Duke Lemur Center in Durham, N.C. “The aye-aye stopped eating and started to pick its nose, and I was really surprised,” says evolutionary biologist Anne-Claire Fabre, who filmed the video. “I was wondering where the finger was going.” An aye-aye is about as big as a house cat, but its clawed middle finger is some 8 centimeters long. And Kali was plunging almost the entire digit up her snout to sample her own snot with dainty licks.
“There is one moment where the camera is [shaking], and I was giggling,” says Fabre, of the Natural History Museum of Bern in Switzerland. Afterward, she asked her colleagues if they had ever seen an aye-aye picking its nose. “The ones that were working a lot with aye-ayes would tell me, ‘Oh, yeah, it’s happening really often,’” says Fabre, who later witnessed the behavior in several other aye-ayes. This got Fabre and her colleagues curious about how many other primate species have been caught with their fingers in their nostrils. The researchers scoured the literature for past studies and the internet for other videos documenting the behavior.
Unfortunately, “most of the literature that we were finding were jokes,” Fabre says. “I was really surprised, because there is a lot of literature on other types of pretty gross behaviors, such as coprophagy,” or poo eating, among animals (SN: 7/19/21). But between all the bogus articles, the team did find some real reports of primate nose picking, including research done by Jane Goodall in the 1970s.
Aye-ayes are now the 12th known species of primate, including humans, to pick their noses and snack on the snot, the researchers found. Others include gorillas, chimpanzees, bonobos, orangutans and macaques. Nose pickers tend to be primates that have especially good dexterity and use tools.
“The team [has] given us the first map of nose picking across our primate family tree, which immediately raises questions about just how much of this behavior is happening out there, unseen or unreported,” Haslam says. He remembers once seeing a capuchin monkey using a twig or stem to pick its nose (SN: 9/6/15).
“I’m surprised that there aren’t more reports on nose picking, especially from zoos where animals are watched every day,” Haslam adds. “Perhaps our own social stigma around it means that scientists are less likely to want to report nose-picking animals, or it may even be seen as too common to be interesting.” The fact that so many primate species have been spotted picking their noses and eating the boogers makes Fabre’s team and Haslam wonder whether this seemingly nasty habit has some unknown advantage. Perhaps eating germ-laden boogers boosts the immune system.
For now, untangling the evolutionary origins and potential perks of nose picking will require a more complete census of what species — primate or otherwise — mine and munch on their own mucus.
It’s official: The number of planets known beyond our solar system has just passed 5,000.
The exoplanet census surpassed this milestone with a recent batch of 60 confirmed exoplanets. These additional worlds were found in data from NASA’s now-defunct K2 mission, the “second life” of the prolific Kepler space telescope, and confirmed with new observations, researchers report March 4 at arXiv.org.
As of March 21, these finds put NASA’s official tally of exoplanets at 5,005.
It’s been 30 years since scientists discovered the first planets orbiting another star — an unlikely pair of small worlds huddled around a pulsar (SN: 1/11/92). Today, exoplanets are so common that astronomers expect most stars host at least one (SN: 1/11/12), says astronomer Aurora Kesseli of Caltech. “One of the most exciting things that I think has happened in the last 30 years is that we’ve really started to be able to fill out the diversity of exoplanets,” Kesseli says
Some look like Jupiter, some look — perhaps — like Earth and some look like nothing familiar. The 5,005 confirmed exoplanets include nearly 1,500 giant gassy planets, roughly 200 that are small and rocky and almost 1,600 “super-Earths,” which are larger than our solar system’s rocky planets and smaller than Neptune (SN: 8/11/15). Astronomers can’t say much about those worlds beyond diameters, masses and densities. But several projects, like the James Webb Space Telescope, are working on that, Kesseli says (SN: 1/24/22). “Not only are we going to find tons and tons more exoplanets, but we’re also going to start to be able to actually characterize the planets,” she says.
And the search is far from over. NASA’s newest exoplanet hunter, the TESS mission, has confirmed more than 200 planets, with thousands more yet to verify, Kesseli says (SN: 12/2/21). Ongoing searches from ground-based telescopes keep adding to the count as well.
“There’s tons of exoplanets out there,” Kesseli says, “and even more waiting to be discovered.”
Rather than solid lumps of rock, ‘rubble pile’ asteroids are loose collections of material, which can split apart as they rotate (SN: 3/16/20). To understand the inner workings of such asteroids, one team of scientists turned to levitating plastic beads. The beads clump together, forming collections that can spin and break up, physicist Melody Lim of the University of Chicago reported March 15 at a meeting of the American Physical Society in Chicago.
It’s an elegant dance that mimics the physics of asteroid formation, which happens too slowly to observe in real-life space rocks. “These ‘tabletop asteroids’ compress phenomena that take place over kilometers [and] over hundreds of thousands of years to just centimeters and seconds in the lab,” Lim said. The results are also reported in a paper accepted in Physical Review X. Lim and colleagues used sound waves to levitate the plastic beads, which arranged themselves into two-dimensional clumps. Acoustic forces attract the beads to one another, mimicking the gravitational attraction between bits of debris in space. Separate clumps then coalesced similarly to how asteroids are thought to glom onto one another to grow. When the experimenters gave the structures a spin using the sound waves, the clumps changed shape above a certain speed, becoming elongated. That could help scientists understand why ‘rubble pile’ asteroids, can have odd structures, such as the ‘spinning tops’ formed by asteroids Bennu and Ryugu (SN: 12/18/18).
Eventually, the fast-spinning clumps broke apart. This observation could help explain why asteroids are typically seen to spin up to a certain rate, but not beyond: Speed demons get split up.
Since Russia’s invasion of Ukraine in late February, people around the world have watched the war play out in jarring detail — at least, in countries with open access to social media platforms such as Twitter, Facebook, TikTok and the messaging app Telegram.
“The way that social media has brought the war into the living rooms of people is quite astounding,” says Joan Donovan, the research director of the Shorenstein Center on Media, Politics and Public Policy at Harvard University. Fighting and explosions play out nearly in real time, and video messages from embattled Ukrainian president Volodymyr Zelenskyy have stirred support across the West.
But that’s not all. Social media is actually changing the way wars are fought today, says political scientist Thomas Zeitzoff of American University in Washington, D.C., who is an expert on political violence. The platforms have become important places to recruit fighters, organize action, spread news and propaganda and — for social scientists — to gather data on conflicts as they unfold.
As social platforms have become more powerful, governments and politicians have stepped up efforts to use them — or ban them, as in Russia’s recent blocking of Facebook, Twitter and Instagram. And in a first, the White House held a special briefing on the Ukraine war with TikTok stars such as 18-year-old Ellie Zeiler, who has more than 10 million followers. The administration hopes to shape the messages of young influencers who are already important sources of news and information for their audiences.
The Ukraine war is shining a spotlight on social media’s role as a political tool, says Donovan, whose Technology and Social Change Project team has been following the spread of disinformation in the conflict. “This is a huge moment in internet history where we’re starting to see the power of these tech companies play out against the power of the state.” And that, she says, “is actually going to change the internet forever.”
Science News interviewed Donovan and Zeitzoff about social media’s influence on the conflict and vice versa. The following conversations have been edited for length and clarity.
SN: When did social media start to play a role in conflicts?
Zeitzoff: Some people would say the Zapatista uprising in Mexico, way back in the 1990s, because the Zapatistas used the internet [to spread their political message]. But I think the failed Green Revolution in Iran in 2007 and 2008 was one of the first, and especially the Arab Spring in the early 2010s. There was this idea that social media would be a “liberation technology” that allows people to hold truth to power.
But as the Arab Spring gave way to the Arab Winter [and its resurgence of authoritarianism], people started challenging that notion. Yes, it makes it easy to get a bunch of people out on the street [to protest], but it also makes it easier for governments to track these folks. SN: How do you see social media being used in the Ukrainian conflict, and what’s different now? Donovan: Some of the platforms that are more well-known, like Facebook and Twitter, are not as consequential as newer platforms like Telegram and TikTok. For instance, Ukrainian groups on Facebook started to build other channels for communication right before the Russian invasion because they felt that Facebook might get compromised. So Telegram has been a very important space for getting information and sharing news.
Telegram has also become a hot zone for propaganda and misinformation, where newer tactics are emerging such as fake debunked videos. These are videos that look like they’re news debunks showing that Ukraine is participating in media manipulation efforts, but they’re actually manufactured by Russia to make Ukraine look bad.
Zeitzoff: I think social media has probably afforded the Ukrainians an easier ability to communicate to their diaspora communities, whether in Canada, the United States or across Europe. It’s also increasingly affording unprecedented battlefield views.
But I think the bigger thing is to think about what these new suites of technology allow, like Volodymyr Zelenskyy holding live videos that basically allow him to show proof of life, and also put pressure on European leaders.
SN: Despite Russia’s big investments in disinformation, is Ukraine winning the social media war?
Zeitzoff: Up to the beginning of the conflict, many Ukrainians were skeptical of Zelenskyy’s ability to lead. But you look back at his presidential campaign, and he was doing Facebook videos where he would talk into the camera, in a very sort of intimate style of campaigning. So he knew how to use social media beforehand. And I think that has allowed Ukraine to communicate to Western audiences, basically, ‘give me money, give me weapons,’ and that has helped. There is an alternative scenario where perhaps if Russia’s military were slightly better organized and had a better social media campaign, it would become very difficult for Ukraine to hold.
And I would say that Russia’s propaganda has been sloppier. It’s not as good of a story. Ukraine already has the underdog sympathy, and they’ve been very good at capitalizing on it. They show their battlefield successes and highlight atrocities committed by Russians.
And the other thing is that social media has helped to organize foreign fighters and folks who have volunteered to go to Ukraine.
SN: Social media is also an enormous source of misinformation and disinformation. How is that playing out?
Donovan: We’re seeing recontextualized media [on TikTok and elsewhere], which is the reuse of content in a new context. And it usually also misrepresents the time and place of the content.
For instance, we’ve seen repurposed video game footage as if it was the war in Ukraine. While we [in the United States] don’t need real-time information to understand what’s happening in Ukraine, we do need access to the truth. Recontextualized media gets in the way of our right to truth.
And we want to make sure the information getting to people in Ukraine is as true and correct and vetted as possible, because they’re going to make a life-or-death decision that day about going out in search of food or trying to flee a certain area. So those people do need real-time accurate information.
There’s one other story about the way in which hope and morale can be decimated by disinformation. Among Ukrainians, there’s a lot of talk about when or if the United States or NATO will send planes. And there were these videos going around suggesting that the United States had already sent planes, and showing paratroopers jumping out. People were sharing these until they got to a reputable news source and heard the news that NATO was still not sending planes. So it can be something as innocent as a video that provides a massive amount of hope to people who share it, and then it’s all snatched away.
SN: What aren’t we seeing on social media?
Donovan: There’s a missing piece, which is that many social media algorithms are set to remove things that are torturous or gory. And so the very violent and vicious aftermath of war is something that the platforms are suppressing, just by virtue of their design.
So in order to get a complete picture of what has happened in Ukraine, people are going to have to see those videos [from other news sources] and be a global witness to the atrocity.
SN: Where is this all heading?
Zeitzoff: I think the biggest thing that’s changing is this decoupling of social media networks across great powers. So you have the Great Firewall [that censors the internet] in China, and I think Russia will be doing something very similar. And how does that influence the free flow of information?
Donovan: We try to understand how information warfare plays out as kind of a chess match between different actors. And what’s been incredible about the situation in Russia is you have this immense titan, the tech industry, pushing back on Russia by removing state media from their platforms. And then Russia counters by removing Facebook and Instagram in Russia.
This is the first time that we’ve seen these companies take action based on the request of other governments. In particular, Nick Clegg [the president of global affairs at Meta, the parent company of Facebook, Instagram and the messaging service WhatsApp] said that they were complying with Ukrainian asks. That means that they are taking some responsibility for the content that is being aired on their platforms. Whatever outcome happens over the next month, I don’t think the internet is going to be as global as it once was.